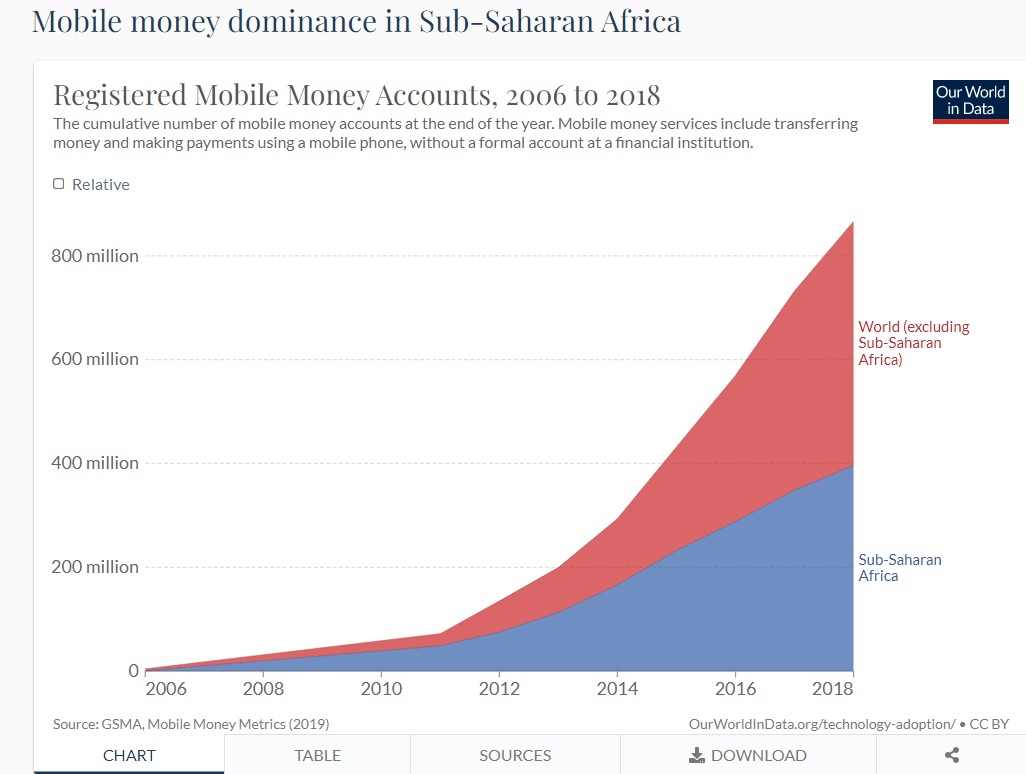
I downloaded Mobile money Accounts, 2006 to 2018 data from Our World in Data. I chose this data because I’m curious in our world’s technological adoption in Sub-Saharan Africa in comparision of the world over the last decade.
This is the Link to the data.
The following code chunk loads the package I will use to read in and prepare the data for analysis
- Read the data in
- Use glimpse to see the names and types of the columns
glimpse (registered_mobile_money_accounts)
Rows: 103
Columns: 4
$ Entity                             <chr> "East Asia and Pacific", ~
$ Code                               <chr> NA, NA, NA, NA, NA, NA, N~
$ Year                               <dbl> 2011, 2012, 2013, 2014, 2~
$ `Registered Mobile Money Accounts` <dbl> 16674768, 14188036, 15693~ View(registered_mobile_money_accounts)
- Use output from glimpse (and View) to prepare the data for analysis
Create the object account that is list of account I want to extract from the dataset
Change the name of 1st column to accounts and the 4th column to Money Accounts
Use filter to extract the rows that I want to keep: Year >= 2006 and account in accounts
Select the columns to keep: account, Year, MobileMoneyAccounts
Use mutate to convert MobileMoneyAccounts to millions of registered accounts
Assign the output to account_mobile
Display the first 10 rows of account_mobile
account  <- c("World (excluding Sub-Saharan Africa)",
             "Sub-Saharan Africa")
account_mobile  <- registered_mobile_money_accounts  %>%
  rename(account = 1, MobileMoneyAccounts = 4 ) %>%
  filter(Year >= 2006, account %in% account)  %>%
  select(account, Year, MobileMoneyAccounts)  %>%
  mutate(MobileMoneyAccounts = MobileMoneyAccounts * 1e-9)

account_mobile
# A tibble: 103 x 3
   account                Year MobileMoneyAccounts
   <chr>                 <dbl>               <dbl>
 1 East Asia and Pacific  2011              0.0167
 2 East Asia and Pacific  2012              0.0142
 3 East Asia and Pacific  2013              0.0157
 4 East Asia and Pacific  2014              0.0245
 5 East Asia and Pacific  2015              0.0318
 6 East Asia and Pacific  2016              0.0490
 7 East Asia and Pacific  2017              0.0685
 8 East Asia and Pacific  2018              0.0946
 9 Eastern Africa         2011              0.0398
10 Eastern Africa         2012              0.0570
# ... with 93 more rows
Check that the total for 2018 equals the total in the graph
# A tibble: 1 x 1
  total_emm
      <dbl>
1      2.60
See how to change the width in the R Markdown Cookbook

Write the data to file in the project directory
write_csv(account_mobile, file="registered_mobile_money_accounts")